Which factor that mostly affects query performance?
People tend to believe that, the query is slow just because the table has lots of rows and all they need is indexing. But obviously, index is NOT free and even useless in some cases. So it's still better to know why the query is slow before coming up with final solution, right?
So, let's find out the X factor that mostly decides how fast query is.
- I'm using Postgres and DBeaver tool for this demo.
- If you don't have Postgres installed on your machine, recommend using Aiven (opens in a new tab), it provides us free 5GB Postgres storage.
May "number of total rows" be the X factor?
Okay so checkout this demo.
Preparation
I will create one table which has ~10M rows, enough for our demo.
create sequence tbl_large_seq start with 1 increment by 1;

create table public.tbl_large (id bigserial, col1 varchar(30), col2 varchar(30), col3 varchar(30), col4 varchar(30), col5 varchar(30));

BEGIN;
DO $$
  DECLARE
    i INTEGER;
  BEGIN
    FOR i IN 1..10000000 LOOP
      INSERT INTO tbl_large VALUES (nextval('tbl_large_seq'), 'Velit quis anim Lorem commodo', 'Velit quis anim Lorem commodo', 'Velit quis anim Lorem commodo', 'Velit quis anim Lorem commodo', 'Velit quis anim Lorem commodo');
    END LOOP;
  END $$;
END;
And here we go, 10M rows are generated.
defaultdb=> select count(*) from tbl_large;
  count
----------
 10000000
(1 row)

Time: 16853.607 ms (00:16.854)
It takes about 16s to count all rows. You can run it multiple times to see other results but it should never less than 1s (at least to me).
defaultdb=> select count(*) from tbl_large;
  count
----------
 10000000
(1 row)

Time: 1154.586 ms (00:01.155)
I will create a new table called tbl_small with the same format but not insert any data in it.
create table public.tbl_small (id bigserial, col1 varchar(30), col2 varchar(30), col3 varchar(30), col4 varchar(30), col5 varchar(30));defaultdb=> select count(*) from tbl_small;
count
-------
0
(1 row)
Time: 213.324 ms~200ms in this case. Much faster compared to the large table, right?
So it comes up with one question. If I delete all of rows of table tbl_large, can the query be fast as tbl_small, or at least, will it have some improvement on response time?
The truth
Before moving on, don't forget to turn off autovacuum on large table. Notice on autovacuum_vacuum_threshold value. We will discuss the reason later, but just don't forget this important step.
ALTER TABLE tbl_large SET (
  autovacuum_vacuum_threshold = 20000000, -- set it larger than 10M (our total rows)
);
Then, delete all rows of large table.
defaultdb=> delete from tbl_large where true;
DELETE 10000000
Time: 26555.155 ms (00:26.555)
Run the query again.
defaultdb=> select count(*) from tbl_large;
 count
-------
     0
(1 row)

Time: 20690.672 ms (00:20.691)
Okay, 20s for this query. No matters how many times you rerun, it will never be less than 1s, again.
defaultdb=> select count(*) from tbl_large;
 count
-------
     0
(1 row)

Time: 1414.278 ms (00:01.414)
The result shows us that, the performance is still staying unchanged even the total row decreased from 10M to zero.
Okay we got the answer now: number of total rows is not the "X" factor.
Page - The real X factor
Ladies and gentle men, our hero is coming. Let's summon him by explaining the 2 queries above with buffers options.
defaultdb=> explain (analyze, buffers) select count(*) from tbl_large;
                                                               QUERY PLAN
----------------------------------------------------------------------------------------------------------------------------------------
 Aggregate  (cost=2.39..2.40 rows=1 width=8) (actual time=4759.365..4759.368 rows=1 loops=1)
   Buffers: shared read=259884
   ->  Bitmap Heap Scan on tbl_large  (cost=1.38..2.39 rows=1 width=0) (actual time=4759.359..4759.360 rows=0 loops=1)
         Heap Blocks: exact=38472 lossy=194087
         Buffers: shared read=259884
         ->  Bitmap Index Scan on tbl_large_pkey  (cost=0.00..1.38 rows=1 width=0) (actual time=670.478..670.479 rows=10000000 loops=1)
               Buffers: shared read=27325
 Planning Time: 0.082 ms
 Execution Time: 4765.051 ms
(9 rows)

Time: 4980.912 ms (00:04.981)defaultdb=> explain (analyze, buffers) select count(*) from tbl_small;
QUERY PLAN
--------------------------------------------------------------------------------------------------------------
Aggregate (cost=12.38..12.38 rows=1 width=8) (actual time=0.010..0.010 rows=1 loops=1)
-> Seq Scan on tbl_small (cost=0.00..11.90 rows=190 width=0) (actual time=0.005..0.005 rows=0 loops=1)
Planning:
Buffers: shared hit=1
Planning Time: 0.065 ms
Execution Time: 0.094 ms
(6 rows)
Time: 217.021 msNotice on Buffers: shared value. On large table, it receives read=259884 and on small table, it receives hit=1. It means that:
tbl_largehas to scan 27325 pages to return resulttbl_smallonly has to scan 1 page to return result
We have difference on query performance due to difference on total pages.
Is it not convincing enough? You can try it by yourself. Create a new table and insert 10M rows. Compare the total scanned pages before and after deletion. It should have the same total pages and therefore the query performance doesn't have any changes.
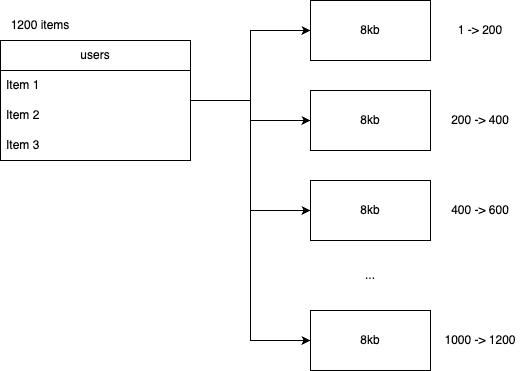
But what exactly is page (or block)?
We can call it either "page" or "block". They are the same.
In term of physical storge, database stores your data in many pages (normally 8kb per page). One page contains many rows.

Do a small query to check total pages of table.
defaultdb=> SELECT COUNT(DISTINCT(sub.block)) FROM (
  SELECT (ctid::text::point)[0]::int AS block
  FROM tbl_large
) sub;
 count
--------
 259884
(1 row)

Time: 12880.248 ms (00:12.880)defaultdb=> SELECT COUNT(DISTINCT(sub.block)) FROM (
SELECT (ctid::text::point)[0]::int AS block
FROM tbl_small
) sub;
count
-------
0
(1 row)
Time: 236.990 msIn most cases where querying without indexes, database has to scan all of pages of table to find your data (FULL TABLE SCAN). The more pages, the slower query is.
How can index help to improve query performance?
Indexing is the most basic technique that is useful for query performance improvement. Of course, it doesn't mean that it is always faster if you use indexes but basically, how can index help us?
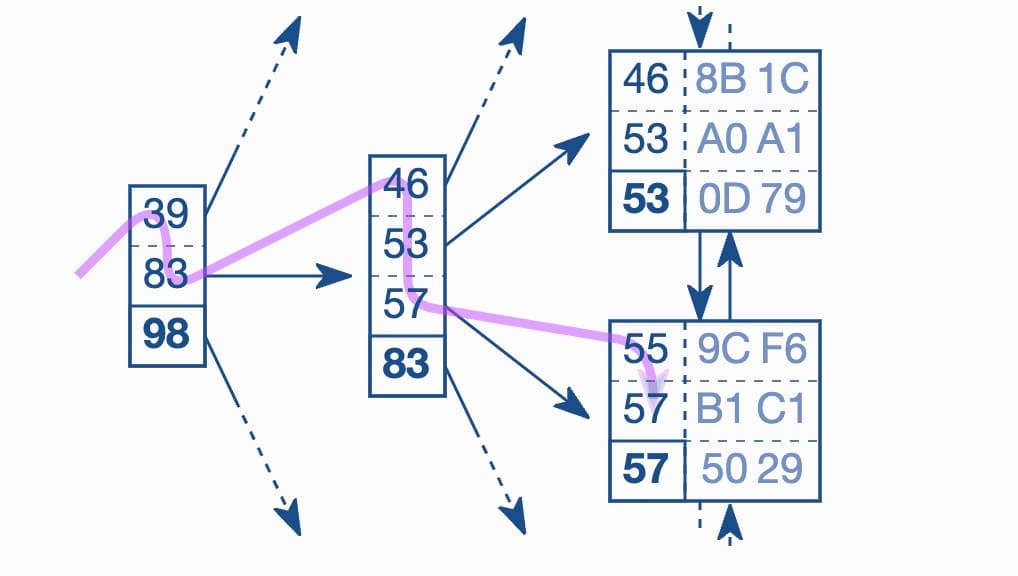
When you create index, it will store index values in new pages and organize those values so that it can find out the page so quickly using some algorithm. Eg: B-Tree index organizes values in B-Tree so it can find out the page using tree traversal.
=> Reduce pages that needs to be scanned.

Conclusion
Okay so we can say that, improving query performance is just trying to reduce the total pages to scan. Sounds easy but it's definitely not. That's it.
P/S
On our demo, we already deleted all of rows in large table but why did query still have to scan so many blocks? Actually when we do delete rows, they are not actually deleted and freed disk space, they are just marked as dead. So the total pages are still the same, the consumed disk space is unchanged.
Check those dead rows by executing query.
defaultdb=> SELECT pg_stat_get_live_tuples(c.oid) AS n_live_tup,
pg_stat_get_dead_tuples(c.oid) AS n_dead_tup
FROM pg_class c where relname = 'tbl_large';

 n_live_tup | n_dead_tup
------------+------------
          0 |   10000000
(1 row)
To clean up dead rows and free disk space, VACUUM is the thing we need. We can execute VACUUM manually but normally database does it for us periodically (autovacuum). Autovacuum is triggered whenever dead rows reach a threshold, of course we did config that threshold to 20M on our demo to prevent autovacuum running and keep dead rows existing on disks.
P/S 2
You may have concerns why after inserting/deleting, the response time has difference between queries (~20s for first time vs ~1s for other next times). As I know, if table size has been changed significantly, Postgres will automatically run ANALYZE to create new statistics of table. That process may take long time to finish. ANALYZE is a part of autovacuum too.
Reference
Thank you for reading. Welcome all your comments/feedbacks.